OCCASIONAL PAPER NO. 36
A Framework for Examining the Relationship Between MEA Scores and Other Academic Indicators in Maine Schools
November 2000
Theodore Coladarci
University of Maine
Robert Ervin
Bangor School Department
David L. Silvernail
University of Southern Maine
Theodore Coladarci is Professor of Education in the College of Education and Human Development at the University of Maine. Robert Ervin is Superintendent of Schools for the Bangor School Department, Bangor, Maine. David Silvernail is Director of the Center for Educational Policy, Applied Research, and Evaluation in the College of Education and Human Development at the University of Southern Maine and Co-director of the Maine Education Policy Research Institute.
A publication of the College of Education & Human Development at the University of Maine and the Penquis Superintendents' Association.The Occasional Paper Series is intended to provide educators and policymakers in Maine with information that can assist them as they address the complex problems confronting their communities, education systems, or students. Papers are distributed periodically as topics vital to educational improvement are addressed by faculty and graduate students at the University of Maine. The opinions and information obtained in the Occasional Paper Series are the authors' and do not necessarily represent those of the University of Maine or the College of Education & Human Development, or the membership of the Penquis Superintendents' Association.
The Center for Research and Evaluation is a nonprofit research unit within the College of Education & Human Development at the University of Maine. Since 1985, the Center has linked the College of Education & Human Development to Maine's schools, communities, and public agencies to more effectively address the complex issues confronting educational systems in the state. To stimulate discussion and promote policy developments, the Center designs and conducts qualitative and quantitative research about school conditions and practices. It disseminates research findings through analytical reviews and bulletins, and publishes original research in The Journal for Research in Rural Education and in a series of occasional papers produced in conjunction with the Penquis Superintendents' Association. The Center also provides evaluation services, including fiscal, curricular, and administrative reviews.
The Center for Research and Evaluation is funded by the University of Maine and through project grants. It is administered and staffed by social science research and evaluation professionals in conjunction with College and University faculty.
Copyright � 2000 by the Center for Research and Evaluation. This paper may be photocopied for individual use.
Center for Research & Evaluation
College of Education & Human
Development
University of Maine
5766 Shibles Hall
Orono, ME
04469-5766
Phone 207-581-2493 � Fax 207-581-2423
|
Equal Opportunity Statement In complying with the letter and spirit of applicable laws and in pursuing its own goals of diversity, the University of Maine System shall not discriminate on the grounds of race, color, religion, sex, sexual orientation, national origin or citizenship status, age, disability, or veterans status in employment, education, and all other areas of the University. The University provides reasonable accommodations to qualified individuals with disabilities upon request. Questions and complaints about discrimination in any area of the University should be directed to Office of Equal Opportunity, University of Maine, Room 101, 5754 North Stevens Hall, Orono, ME 04469-5754; (207) 581-1226 (voice and TDD). |
![]()
A Member of the University of Maine System
INTRODUCTION
The Maine Educational Assessment (MEA) has changed markedly since its debut in 1984. First, the format has changed. An entirely selected-response test in the beginning, the MEA soon added constructed-response items, and then eliminated selected-response items altogether. The present MEA has returned to a mixture of the two item types. Second, the way student performance is reported has changed. Scale scores initially ranged from 100 to 400, and the performance levels (added later) were novice, basic, advanced, and distinguished. Today, scale scores range from 501 to 580, and the performance levels are does not meet the standard, partially meets the standard, meets the standard, and exceeds the standard. Finally, and arguably most important, the content of the MEA has changed. What began as a generic, norm-referenced measure of academic achievement is now a standards-based test that putatively is aligned with the Maine Learning Results (Maine Department of Education, 1997).
The new MEA, accompanied by the mounting rhetoric of accountability and proposed interventions for low-performing schools, is increasingly assuming the posture of high-stakes assessment. Such a test, of course, should be of demonstrable validity. That is, (a) the MEA should measure what it is supposed to measure�the Learning Results�and (b) interpretations, inferences, and actions based on MEA scores should be logically and ethically defensible.1
Although there are various ways to examine validity, we believe that "content validity" is the most critical form of validity with respect to the MEA and its use in Maine schools. Simply put, content validity refers to the degree to which the items and tasks that constitute the MEA are relevant to, and representative of, the Learning Results. Once the content validity of the MEA is clearly documented, stakeholders can be confident that this test indeed measures "what it is supposed to measure." Furthermore, they will have essential information for monitoring the defensibility of their interpretations, inferences, and actions that derive from MEA scores. The contractor, Measured Progress (formerly Advanced Systems in Measurement and Evaluation), will soon release a technical report that, among other things, is expected to document this critical aspect of MEA validity.
The Importance of Local Evaluation
But this paper is not about MEA content validity. Rather, we wish to provide
a framework for the conduct of local evaluations involving the MEA. In
particular, we encour
age districts, and the schools they comprise, to
explore the manner in which MEA scores are associated with local indicators of
student achievement and academic orientation.
We should emphasize that, unlike the demonstration of content validity, results from the sorts of analyses we propose will not speak directly and unequivocally to the validity of the MEA, in and of itself. For example, suppose you discover that MEA scores in your district are entirely unrelated to the grades that students receive. Does the reason reside in the MEA, the local curriculum, the way teachers assign grades, or some combination of these factors? Although there often are no immediate, self-evident answers to such questions, the questions are important to ponder nonetheless. We believe that the best questions arise from local data, and that the most defensible answers�working hypotheses, actually�derive from the kinds of local evaluations we describe below.
Indeed, only local evaluation can meaningfully address the beliefs, concerns, and questions that surface in a school or district about MEA scores and how they relate to other student characteristics. The local sentiment regarding this test may be largely positive (e.g., "The MEA is an important complement to the achievement data we collect locally."), skeptical (e.g., "The MEA has little to do with what we already know about our students."), or agnostic (e.g., "How do MEA scores relate to what we already know about our students?"). Whatever its flavor, the prevailing sentiment can be�should be�addressed empirically through local evaluation. Further, local evaluation can be an illuminating component of a local assessment system (see Coladarci et al., 2000), particularly where analyses speak to the relationship between MEA scores and locally available measures of academic achievement.
Local evaluation serves a larger purpose, as well. As the results of local evaluations are synthesized and collated by interested parties, considerably more will be known about the MEA and its relationship to a wide range of academic indicators employed in Maine schools. This knowledge, in conjunction with any formal documentation that Measured Progress or the Maine Department of Education may provide, will go well beyond what is typically known about a state-mandated test.
The Correlation Coefficient
In the analyses we propose and illustrate, one determines the degree to which MEA scores "correlate" meaningfully with important criteria (e.g., teacher-assigned grades). A correlation coefficient is a statistical index (r) that ranges from 0 to �1.00, and it conveys the degree of linear association between two variables (see Minium, Clarke, & Coladarci, 1999, ch. 7). Using 1999 data, for example, we found that the correlation is r = .89 between a high school's average MEA reading score and its average social studies score. This relationship is illustrated in Figure 1, where each diamond, or data point, represents a different high school (n = 130).2 As you see from this scatterplot, schools low in reading also tend to be low in social studies, just as schools high in one tend to be high in the other. Further, these data points show minimal scatter around an imaginary straight line, which proceeds from the lower left to the upper right. Thus, these two variables demonstrate a strong, and positive, linear relationship.3
An Example of Local Evaluation
We illustrate several of the proposed analyses with results recently obtained by the Bangor School Department. Their local evaluation, a collaboration between the first two authors, was based on a random sample of 70 high school students who took the 11th grade MEA in 1998-1999, the first year of the test's alignment with the Learning Results. Bangor's approach is by no means exhaustive, nor should their analyses be viewed as an inviolable template. Instead, we encourage readers to consider the experience of this particular school district as an example�an example, we hope, that will suggest possibilities for local evaluations in other communities.
Before proceeding, we should assure readers that the sorts of evaluation
studies we propose do not require local expertise in statistical procedures.
Rather, the primary requirement for the district is the preparation of a common
spreadsheet (e.g., Excel). This spreadsheet could then be e-mailed as an
attached file to a qualified person, who would conduct the analyses and report
back to the district.4 Hav ing said this, our hope is that districts
ultimately will develop the local capacity to conduct such evaluations with
little outside assistance.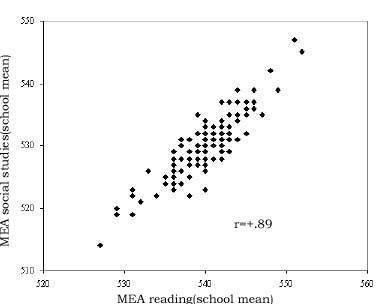
Figure 1. The relationship between 11th grade MEA reading and MEA social studies
(school level, n = 130)
Table 1
Correlations Between 11th Grade Cumulative GPA and 11th
Grade MEA Scores (Bangor School Department)
| MEA content area | |
| Writing
Reading
Math
Science
Social
Studies |
|
| Cumulative
GPA |
.46 .53 .63 .55 .57 |
Illustrative Questions to Guide Local Evaluations
The questions below, we believe, represent an important first step toward a comprehensive exploration of MEA scores and their correlates. Inevitably, readers will find some questions to be of greater local interest than others. We also expect�indeed, hope�that readers will generate additional questions from those we offer.
� Are MEA scores related to the grades that students earn in class?
Regardless of the content changes that have been made to the MEA, one would expect this test to be meaningfully related to the grades that students receive in school. This question is easily addressed by correlating MEA scores with teacher-assigned grades. These correlations can be examined separately by subject, as in determining the correlation between, say, 4th grade MEA mathematics scores and 4th grade mathematics grades. For a subject-specific correlation such as this, one must take care to base the correlation on comparable courses. For instance, it arguably would make little sense to examine the correlation between 8th grade MEA science scores and 8th grade science grades if some students enrolled in accelerated science while others took the regular offering. In this case, the correlation should be determined separately for each group of students.
At the secondary level, one also has the option of using cumulative GPA. As
an example, the Bangor School Department determined the correlation between 11th
grade cumulative GPA and each of the five MEA scores that are reported for
students. As the positive correlations in Table 1 testify, stronger students (as
indicated by cumulative GPA)
tend to do better on the MEA tests, and weaker
students tend to do less well.
Interpreting the magnitude of correlations requires judgment; there are no defensible benchmarks, considered in isolation, for determining whether a correlation is "small," "moderate," or "large." At the very least, the algebraic sign of the correlation should be consistent with logic! For example, there would be something terribly wrong�either with the MEA or local grading practices�if any correlation in Table 1 were negative (i.e., students who receive higher grades do poorly on the MEA, and students with lower grades do relatively well). As for the meaning of the correlations one obtains, judgments invariably are reasoned speculations and subject to further inquiry. Table 1, for instance, suggests that the relationship between MEA scores and cumulative GPA is less pronounced in the area of writing (r = .46). Why is this? One possibility is that the MEA writing test has lower reliability than the other MEA tests. (The reliability of a test places an upper limit on the degree to which the test can correlate with other variables.) The MEA technical report, forthcoming from Measured Progress, should be helpful for appraising this speculation. Another possibility is that, in comparison to the other content areas, "writing" does not figure as prominently in the judgments, sources of evidence, and so forth that inform the determination of GPA in this school district. Local inquiry regarding local practices would throw light on this possibility.
One also can compare the correlations in Table 1 with those involving an achievement test other than the MEA.
3A negative (or inverse) relationship is where the data points in the scatterplot proceed from the upper left corner downward to the lower right. This pattern would emerge, for example, if you substituted "MEA social studies" in Figure 1 with "percentage of students on free or reduced lunch."
4For example, this service can be provided by either the Center for Research and Evaluation at the University of Maine, or the Center for Educational Policy, Applied Research, and Evaluation at the University of Southern Maine.
Table 2
Correlations Between 11th Grade Cumulative GPA and 10th
Grade Metropolitan Achievement Test Scores (Bangor School Department)
| MAT content area | |
| reading
math
science
social
studies |
|
| CumulativeGPA | .53 .57 .50 .41 |
For example, the Bangor School Department correlated GPA with 10th grade
Metropolitan Achievement Test (MAT) scores. These correlations show that the MEA
generally correlates with school grades as well as the MAT does (Table 2). An
interesting exception is found in the area of social studies, where the
relationship is stronger for the MEA
(r = .57 vs. .41).
By the way, how do you think "subject-specific" correlations would compare to correlations based on cumulative GPA? For this same sample of students, suppose we also had determined the correlation between, say, MEA math scores and math grades. Would you expect this correlation to be higher, lower, or comparable to r = .63 (Table 1)? As you probably are thinking, one would expect a subject-specific correlation to be higher than that based on cumulative GPA. This is because the variables in a subject-specific correlation are measuring a more similar domain (in this case, mathematics ability).
� Are MEA scores related to future grades earned in class?
This question differs from � only in that the emphasis now is on the "predictive," rather than "concurrent," validity of the MEA. For example, do 4th grade MEA scores correlate meaningfully with grades earned in the middle-level years? Are 8th grade MEA scores correlated with grades subsequently earned in high school? To address such questions, one merely records earlier MEA scores and later teacher-assigned grades, and then determines the correlation between the two.
� Are MEA scores related to performance on standardized achievement tests?
Most districts in Maine annually administer a standardized achievement test.
Although not identical in content, the MEA and any commercially available
achievement test are both measures of "academic achievement" and, further, they
both report scores for many of the same content areas. Consequently, it is
reasonable to expect that student performance on one battery will correlate with
performance on the other.
As an example, the Bangor School Department correlated 11th grade MEA scores with 10th grade MAT scores.5 The results of this analysis are shown in Table 3, which contains quite a bit of information. The four shaded correlations show the relationship between the MEA and MAT for each (common) content area. You can see that the correlations for mathematics (r = . 83) and science (r = .74) are fairly robust, whereas those for reading and social studies, while strong, are somewhat more modest (rs = .63 and .57, respectfully). In part, the two lower correlations doubtless reflect differences between the MEA and MAT in how "reading" and "social studies" are conceptualized and, therefore, in how the content of each test is specified. You also see that the remaining correlations between the MEA and MAT generally are smaller than the shaded values. And this stands to reason: Two measures of a similar construct (e.g., MEA mathematics and MAT mathematics) should correlate more highly than measures of dissimilar constructs (e.g., MEA mathematics and MAT social studies).
A quick examination of the correlations among the MEA tests (upper left triangle) and among the MAT tests (lower right triangle) reveal similar degrees of intercorrelation. Interestingly, MEA writing correlates less with the other MEA content areas (rs = .34 to .49) than these content areas correlate with each other (rs = .54 to .70). Again, this may suggest a lower reliability for the writing component of the MEA. This pattern of correlations also may suggest differences in the degree to which, and manner in which, "writing" is evaluated in each MEA content area. The forthcoming MEA technical report should be informative for appraising this possibility, as well.
Finally, the Bangor School Department identified those high school students, in the original sample of 70, who had elected to take the Scholastic Assessment Test (SAT). A correlation of r = .92 was obtained between MEA mathematics scores and performance on the mathematics portion of the SAT (SAT-M). Clearly, students who do well on the MEA mathematics test tend to do well on the SAT-M, just as students who do poorly on one tend to do poorly on the other. This degree of association is comparable to the correlation of r = .91 that Bangor obtained between MAT mathematics scores and the SAT-M.
Table 3
Correlations Among Content Area Scores on the 11th Grade
MEA and the 10th Grade Metropolitan Achievement Test (Bangor School
Department)
| MEA | MAT | |
| writing reading math science social
studies |
reading math science social
studies |
|
| MEA writing | 1.00 | |
| MEA reading | .49 1.00 | |
| MEA math | .34 .54 1.00 | |
| MEA science | .40 .63 .70 1.00 | |
| MEA social studies | .44 .65 .62 .70 1.00 | |
| MAT reading | .40 .63 .68 .65 .68 | 1.00 |
| MAT math | .26 .55 .83 .68 .55 | .73 1.00 |
| MAT science | .09 .57 .69 .74 .55 | .67 .78 1.00 |
| MAT social studies | .30 .54 .54 .62 .57 | .77 .61 .70 1.00 |
� Are MEA scores related to future performance on standardized achievement tests?
This question differs from � in the same manner that � differs from �. Here, the emphasis is on the predictive validity of the MEA with respect to student performance on standardized achievement tests. One merely records earlier MEA scores and later scores on the district-wide standardized achievement test, and then determines the correlation between the two.
� Are MEA scores related to teacher judgments of student proficiency?
Teachers have been shown to provide fairly valid estimates of how their students perform on standardized achievement tests. From their review of the extant research, Hoge and Coladarci (1989) found that the correlation between teacher judgments and student performance ranged from approximately r = .50 to r = .90, with a median correlation of r = .69. How well do MEA scores agree with what teachers believe their students know and are able to do vis-�-vis the Learning Results?
This interesting question is not as easy to address as the previous questions, insofar as one must collect information that goes well beyond what typically is available. In January 2000, the Bangor School Department took an initial stab at this with respect to the 11th grade MEA mathematics test. The high school math teachers were convened and asked to provide reasoned estimates of their students' performance on the mathematics portion of the MEA. Teachers first reviewed the Learning Results mathematics content area, the corresponding performance levels, and the released common items. Each teacher was then given a short list of students he or she had the year before, when the 11th grade MEA was administered. With grade book at hand (to refresh the memory), the teacher provided an estimated math score by placing a mark on a horizontal scale that ranged from 501 to 580.6 From these marks, a teacher estimate was recorded for each student, which was then correlated with actual MEA mathematics scores. The Bangor School Department obtained a rather impressive correlation of r = .72 between teachers' judgments and students' actual scores.
6This scale also highlighted the demarcation points between
adjacent performance levels (521, 541, and 561). This entire exercise was
conducted before MEA scores had been returned to schools. The pool of students
for whom teachers made judgments was limited to the sample of 70 students on
which the other analyses reported here was based.
Table 4
Correlations Between High School Test Scores and
Educational Aspirations (Bangor School Department)
| Correlation with educational aspirations | |
| MEA writing | .40 |
| MEA reading | .52 |
| MEA math | .43 |
| MEA science | .41 |
| MEA social studies | .57 |
| MAT reading | .36 |
| MAT math | .37 |
| MAT science | .26 |
| MAT social studies | .26 |
� Are MEA scores related to self-reported proficiency?
How well do MEA scores agree with students' beliefs about what they know and are able to do vis-�-vis the Learning Results? For example, do students who feel confident in their knowledge of science, as delineated in the Learning Results, obtain higher scores on the MEA science test than students who feel deficient or inadequately prepared in this regard? Students easily can be surveyed about such beliefs and feelings, which can then be correlated with MEA performance.
� Are MEA scores related to students' perceptions of the relevance and usefulness of the Learning Results?
Some students, particularly in high school, feel that school is disconnected from what is important to them and what they need to know in order to succeed in life (e.g., Maine Commission on Secondary Education, 1998). Others have a decidedly more positive, integrative view of their academic experience. What are students' perceptions of the relevance and utility of the Learning Results, and are these perceptions meaningfully associated with performance on the MEA? As with �, student perceptions in this regard can be easily surveyed and, in turn, correlated with MEA scores.
� Are MEA scores related to the educational aspirations of students?
Although the Learning Results are standards intended for all students, one nonetheless would expect higher MEA scores among those who harbor high educational aspirations compared to students who, say, have no intentions whatsoever of pursuing postsecondary education. This is due to a host of factors: motivation, academic orientation, and course selection, to mention only a few. Does this expectation, in fact, hold up to empirical scrutiny? Perhaps the most direct approach for answering this question is to assess the educational aspirations of students through a brief, one-item survey, and then correlate the responses with MEA scores. Because the validity of such self-reports is higher with adolescents than with younger children, the most defensible analysis arguably would be conducted in the high school years and, therefore, using 11th grade MEA scores. Nevertheless, analyses using the 4th grade and 8th grade MEA scores could prove illuminating, as well.
There also are more "indirect" ways to get at the notion of educational aspirations that, happily, do not require the collection of new data. For instance, the Bangor School Department created a variable that represented whether or not a high school student had taken the SAT, a test used for college admissions purposes. This variable carried a value of "1" for those students who had taken the test, and a value of "0" went to those who had not. (The critical assumption, of course, is that these two groups of students have markedly different educational aspirations.) This dichotomous variable was then correlated with MEA scores, which, as Table 4 shows, results in correlations ranging from r = .40 (writing) to r = .57 (social studies). In other words, college-bound students indeed tend to have higher MEA scores. Table 4 also provides the correlations when based on MAT scores, which you see are uniformly smaller. Why would the relationship between educational aspirations (as defined here) and test performance be more pronounced when based on the MEA? A distinct possibility is that, for this sample of students, the MAT is easier than the MEA. Other things equal, an easier test will "discriminate" less between college-bound students and those who are not.
Although we expect to see positive correlations between MEA scores and educational aspirations, the magnitude of these correlations should become smaller as a school district works toward full implementation of the Learning Results. That is, if these standards indeed are intended for all students, then a student's achievement of the Learning Results should grow increasingly less dependent on that student's postsecondary plans.
� Are MEA scores related to course-taking patterns?
One of the most established relationships in educational research is between opportunity to learn and academic achievement (e.g., Carroll, 1963). How does this pertain to test validity in general, and to local evaluations of MEA data in particular? Simply put, we would expect higher MEA scores among students who have been engaged in more advanced coursework. For example, middle-level students who take accelerated classes should tend to have higher MEA scores than students in the regular curriculum, just as high school students who enroll in honors or AP classes should tend to have higher MEA scores than students who do not.
Consider the Bangor School Department analysis, again focusing on high school mathematics. Each mathematics course that Bangor High School offers was assigned a value representing the course's location in the mathematics sequence: a low value corresponds to a course early in the sequence (e.g., pre-algebra), whereas a high value corresponds to an advanced course (e.g., calculus). What is the relationship between (a) the highest level of mathematics that a student has taken by the end of the junior year and (b) that student's 11th grade MEA mathematics score? Again, we would expect higher scores among students who have taken more advanced coursework in mathematics, and lower scores among students who have not. And this is just what the Bangor School Department found (r = .79). A subsequent analysis revealed comparable correlations when based on MAT mathematics scores (r = .78) or scores on the SAT-M (r = .82).7
A NOTE ON THE CONSEQUENCES OF THE MEA
The foregoing questions, by their very nature, require the calculation of
correlation coefficients. To be sure, there are many other deserving questions
regarding the MEA pro
gram and local considerations that do not rely on
statistical methods. A recent addition to traditional conceptualizations of
validity concerns the intended and unintended "consequences" of assessment
(e.g., Messick, 1995; Shepard, 1993). For example, an intended consequence of
the annual administration of the MEA is that, over time, there will be greater
alignment between (a) the Learning Results and (b) local instruction and
assessments. Is there evidence that this, in fact, is happening? Observations,
interviews, and surveys can throw light on this question. An example of an
unintended, and decidedly negative, consequence of the MEA is where
instructional alignment is so excessive that districts sacrifice local
curricular goals that, while important, are not explicitly related to the
Learning Results (Coladarci et al., 2000). Again, is there evidence that this is
occurring? Observations, interviews, and surveys can be illuminating here, as
well.
There are many other possible questions pertaining to local consequences, both intended and unintended, of the annual administration of the MEA. Questions will vary both in their focus (e.g., attitudes, beliefs, practices) and in the stakeholders they target (e.g., teachers, students, parents, taxpayers, media). We encourage readers to give this important matter some thought, and to identify sources of evidence that would be the most informative.
CONCLUDING THOUGHTS
The questions above, as well as those that readers generate, represent an important first step toward a comprehensive, local exploration of the MEA and other indicators of academic achievement. Again, we wish to emphasize that the correlation-based questions do not require local expertise in statistical procedures. The most important requirement is a curiosity about the manner in which MEA scores are related to other student characteristics, and the resolve to initiate local evaluations that speak to these relationships. These evaluations can be conducted entirely with local resources or, if need be, in consultation with others. If outside assistance is required, our hope is that the district ultimately would develop the local capacity to conduct such evaluations independently. In any case, results from these evaluations will speak directly to local interests, as well as collectively provide information that is of state-wide significance.
7The latter correlation was based on a subset of the sample: those students who had taken the college admissions test by the fall of their senior year.
REFERENCES