SPECIAL EDUCATION IN MAINE:
ATTAINING
EQUITY THROUGH
PROGRAM AND FINANCE REFORM
Maine Education Policy Research Institute
A nonpartisan
research institute funded by the Maine State Legislature,
the University of Maine, and the University of Southern Maine.
WHITE PAPER
SPECIAL EDUCATION IN MAINE:
ATTAINING EQUITY THROUGH PROGRAM AND FINANCE REFORM
Prepared for the
Maine Education Policy Research Institute
by
Walter J. Harris, Ph.D.
Pushpam Jain, Ph.D.
August 2002
Published by the Maine Education Policy Research Institute, Orono Office, The University of Maine.
This white paper was requested by a subcommittee on special education of the Maine State Board of Education
Statements and opinions by the authors do not necessarily reflect a position or policy of the Maine Education Policy Research Institute, nor any of its members, and no official endorsement by them should be inferred.
In complying with the letter and spirit of applicable laws and in pursuing its own goals of diversity, The University of Maine System shall not discriminate on the grounds of race, color, religion, sex, sexual orientation, national origin or citizenship status, age, disability, or veterans status in employment, education, and all other areas of the University. The University provides reasonable accommodations to qualified individuals with disabilities upon request. Questions and complaints about discrimination in any area of the University should be directed to Office of Equal Opportunity, University of Maine, Room 101, 5754 North Stevens Hall, Orono, ME 04469-5754; (207) 581-1226 (voice and TDD).
This publication is available in PDF format at our website: http://libraries.maine.edu/cre
Copies of this publication are available at no charge from:
Center for Research
and Evaluation, College of Education & Human Development
The University of Maine, 5766 Shibles Hall,
Orono, ME 04469-5766
(207) 581-2493 • FAX (207) 581-9510
A Member of the University of Maine System
SPECIAL EDUCATION IN MAINE: ATTAINING EQUITY
THROUGH PROGRAM AND FINANCE REFORM
Executive Summary
Program and finance reform are needed in Maine's special education program. A high level of variance in the prevalence of students with disabilities in school districts across Maine indicates that students who need special education programs are not being identified in some districts and are being over identified in others. Place of residence may be an obstacle to special education services for some students with disabilities. Scarce special education resources may be misdirected because allocation is based on local practices for determining eligibility for special education that may not reflect actual need. Compared to other education programs, the share of special education has increased more rapidly in the state budget over the last decade.
The major trends in special education program and finance from 1993 to 2002 are:
Program
* State enrollment declined by -3.1% when special education enrollment increased by 26.1%.
* The number of special education students as a proportion of the general student population has increased from 13.4% in 1992-1993 to 17.4% in 2001-2002.
* Nationally, Maine is consistently among the top five states in the proportion of students with disabilities.
* The prevalence rates among Maine school districts vary from 6% to 27%.
* Primarily, local special education practices generate the differences in local identification rates, with poverty having some influence.
Finance
* The special education share of the education budget increased from 11.3% in 1992 to 14.3% in 2001.
* Over the past decade, special education program expenses increased 87.4% when total education expenses increased 47.6%.
* Increases in state per-pupil operating cost and state per-special education-pupil operating cost have been comparable.
To ensure greater equity for students in special education, and maintain a balance between special education and other education programs, both special education programs and funding need to be reformed. Program reform is essential to create a higher degree of uniform judgments about student eligibility for special education. This is necessary to ensure that in all SAUs, eligible students with disabilities are identified and receive services, regardless of where they attend school. Program reform can begin the process of finance reform, in assuring greater confidence that resources are being allocated based on actual need. Finance reform is needed to ensure that sufficient subsidy is provided to every school district so that all students, including those with disabilities, have the resources needed to achieve the Learning Results, and to ensure equity between special education and other education programs.
Potential Strategies for State Leadership
* Review and refine the criteria for eligibility for special education services
* Provide professional development opportunities for directors of special education related to eligibility criteria and leadership of pupil evaluation teams
* Provide professional development opportunities for pupil evaluation teams
* Provide technical assistance to school districts in which prevalence rates differ significantly from the state average
* Encourage teacher education programs to emphasize the need for preservice teachers to gain skills in teaching students with diverse learning styles and to make appropriate referrals
* Guide school districts in creating non-special education supportive programs particularly in high-prevalence districts
* Monitor the impact of Learning Results and increased school district accountability for student achievement on special education prevalence rates
Potential Strategies for Local Leadership
* Create more non-special education alternative programs for students who are not clearly eligible for special education programs
* Provide professional development opportunities for teachers that expand their abilities to teach students with diverse learning styles and challenging behavior
* Encourage general and special educators to work collaboratively in support of all students' learning and development
* Provide professional development for pupil evaluation teams
SPECIAL EDUCATION IN MAINE: ATTAINING EQUITY
THROUGH PROGRAM AND FINANCE REFORM
Introduction
Educating students with disabilities became an integral part of education in the United States with the passage of the P.L. 94-142, the Education of All Handicapped Children Act in 1975, reauthorized as the Individuals with Disabilities Education Act (IDEA) in 1997. State implementation of this federal legislation has created a variety of similar processes for identifying students who are eligible for special education services and ensuring that their educational needs are met at the local level. In many Maine towns there are frequent discussions about special education that typically center on concern and frustration with the increasing burden of financing special education programs in public schools. However, there is little general awareness of how students become eligible for special education, how many students receive special education services, and the types of services they receive.
Advocates for meeting the needs of students with disabilities often maintain that programs and services, particularly those in poor and rural school districts, are inadequate and under funded. Others maintain that the costs of special education programs are increasing, unpredictable, and diminishing the resources available to students without disabilities. More consistent, however, is the widespread finger pointing at the federal government for not providing the level of funding initially promised for special education programs.
This paper provides policymakers with objective information about trends in special education enrollment and funding as they strive to provide equitable educational programs for all Maine students. It will contrast Maine with the nation and Maine school districts with each other. The paper is divided into two parts.
Part I provides some basic information about the provision of special education in Maine. It describes the process by which school administrative units make the critical determination of eligibility for special education services and the types of services provided. It compares Maine and national trends in the prevalence of students with disabilities, it examines the variance in prevalence, and it identifies factors that influence this variance. Finally, Part I summarizes the impact of variable local practices in special education.
Part II extends this discussion to special education funding. As Maine reforms school funding based on the essential programs and services needed to help students achieve the Learning Results rather than on historical costs, changes in special education funding are necessary. Part II explains Maine's current percentage reimbursement model. It examines special education funding trends over the past decade and how this has impacted general education. The paper concludes with a recommendation for program and finance reform in special education and with suggestions for achieving these goals.
Part I
Special Education in Maine: Eligibility and Prevalence
Process and Programs for Students with Disabilities
Maine law (20-A M.R.S.A. Chapters 301-311), guided by the Federal Individuals with Disabilities Education Act (IDEA, P.L. 105-17, 20 U.S.C 1401 et seq.), entitles all students with disabilities, including those who have been suspended or expelled, to "...a free appropriate public education . . . designed to meet their [the students'] unique needs and prepare them for employment and independent living" (Maine Special Education Regulations, 1999, p.1). State regulations guide special education; however, local decisions and interpretations of state guidelines allow for variation among districts in identification processes and the scope of special education programs.
For a student to be identified as eligible for special education services, he or she is initially referred by either school staff, parents, individuals, or agency representatives who have knowledge of the student's academic and behavioral characteristics. A pupil evaluation team (PET) in each school administrative unit (SAU) reviews pertinent assessment data, determines eligibility, and designs and evaluates each student's Individual Education Program (IEP). The PET is the official decision-making body and consists of the student's parent(s), the student (when appropriate), at least one of the student's regular education teachers, a special education teacher, and a representative of the SAU.
Federal and Maine statutes guarantee certain due process rights to students with disabilities and their parents. These include timely notification of PET meetings, access to records, granting of consent for assessment and placement, independent educational evaluation of their child at school district expense, mediation, complaint investigation and impartial due process hearing rights to resolve disputes.
A critical step in determining whether or not a student is eligible for special education services is assessment of the student's educational performance by qualified individuals. The majority of SAUs contract with school psychological service providers to conduct these assessments and provide reports to PETs.
In Maine, special education services must be provided to any child that a PET has determined to have one or more of fourteen disabilities as shown in Table 1. Table 1 indicates the number and percent of students served in Maine in each category of disability in 2000-2001 and allows comparisons to the national percent of students in each category in the same year.
The top ranked disability categories in Maine in 2000-2001 were Specific Learning Disabilities (36.9%), Speech and Language Impairment (27.3%), Emotional Disability (10.8%) and Multiple Disabilities (8.0%). National data reflects the same two top ranks for Specific Learning Disability (45.6%) and Speech and Language Impairment (22.35%) but includes Mental Retardation (10.02%) as third rank and Emotional Disability (7.56%) as fourth rank.

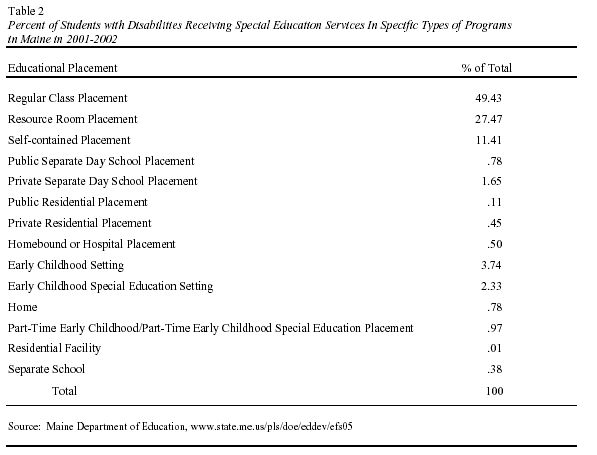
Special education programs were provided to approximately 36,600 students ages 3 to 21 in 2001-2002 or 17% of Maine's 209,900 students. The distribution of all students with disabilities among types of special education programs is represented in Table 2.
The goal of special education programs in Maine is to serve students with disabilities in the least restrictive environment, or an educational setting highly similar to the regular classroom. As indicated in Table 2, nearly half (49.3%) of all students with disabilities receive special education programs in regular classrooms. Students who receive special education services are expected, like all students, to achieve the standards described in the Learning Results.
Trends in Special Education Enrollment: Maine and the Nation
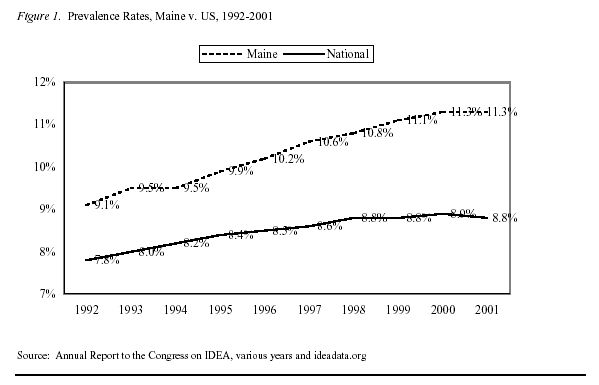
Since 1992-1993, Maine has ranked among the top five states in the proportion of students it serves in special education. In 2000-2001, Maine ranked fourth among all states in the prevalence of students with disabilities between the ages of 6 and 21. First among the states was Rhode Island with 11.80%, followed by West Virginia 11.70%, New Jersey 11.45%, Maine 11.32%, and Massachusetts, 10.85% (U.S. Department of Education, 2001). Maine's neighboring states, New Hampshire and Vermont, ranked 10th and 18th respectively. Maine's prevalence rate over the past decade has also increased at a somewhat faster rate than the national average as illustrated in Figure 1.
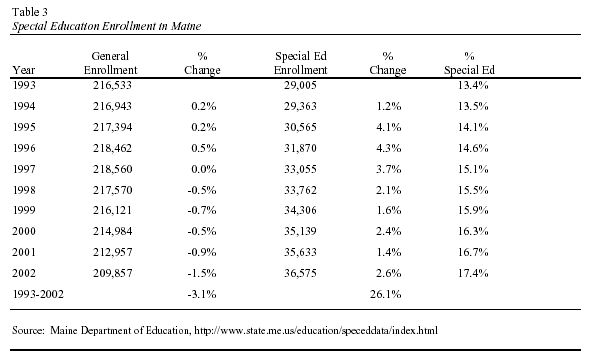
More recent Maine Department of Education data suggest that special education enrollment for students aged 3-21 has increased faster than the general enrollment, as shown in Table 3. From 1992-1993 to 2001-2002, the number of special education students as a proportion of general education students has increased from 13.4% to 17.4%1.
The specific reasons for the overall increase in the number of students with disabilities is a matter of national conjecture. Fujiura and Yamaki (2000) cite poverty and single parent
families as causal factors while Parish (2000) suggests that as performance standards are raised, an increasing number of general education students are being referred to special education.
Understanding Prevalence Rates in Maine School Districts
What factors influence the prevalence of students with disabilities in Maine schools? Three major studies were conducted to better understand the prevalence of students with disabilities among Maine school districts. The first, conducted jointly by the Institute for the Study of Students at Risk and the Maine Education Policy Research Institute (MEPRI), interviewed special education directors to understand variations in local practices between high- and low-prevalence school districts and to identify common issues of concern (Davis & Harris, 2000). This study found that though there were common factors in high- and low- prevalence districts, certain local practices differentiated these groups of districts.
Differences in Local Practices
An analysis of interviews2 with directors of special education revealed that districts with high-prevalence rates of students with disabilities were significantly different from districts with low-prevalence rates, in certain key respects (Table 4).
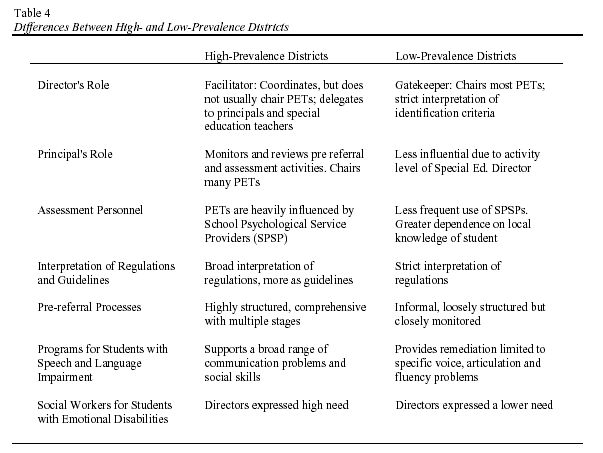
In high-prevalence districts, directors of special education could be characterized as facilitators of the special education process who rely on principals or special education teachers to chair PETs. There was evidence of highly structured pre-referral processes and PETs that were heavily influenced by School Psychological Service Providers. In contrast, low-prevalence districts had directors of special education who functioned more as gatekeepers, interpreting criteria for eligibility very conservatively and chairing most PETs. Pre-referral processes seemed less structured in low prevalence districts and School Psychological Service Providers had less influence on PET decisions.
Variations in local practices, or how special education programs are structured and administered in high-prevalence and low-prevalence districts, provide support for the contention that equitable access to special education services can vary depending on where a student lives.
Consider the cases of Patrick and Derek...
Contrasting Approaches
|
|
| Contributed by Diane Jackson, Ph.D., Special Education Faculty at the University of Maine and assessment specialist to regional school districts. |
The cases of Patrick and Derek exemplify the variation in interpretation of the criteria used to determine eligibility for special education services.
Special education directors in both high- and low-prevalence districts also shared some common concerns. These included the following:
* There is general satisfaction with the processes of referral, identification, and assessment that currently exist. Only a few directors expressed concern for the need to refine diagnostic criteria and bring greater uniformity to the state.
* There is a need for more non-special education alternative programs for students whose disabilities are not sufficiently severe to warrant special education.
* Additional training in the identification and assessment of students with disabilities is needed for general and special educators and for administrators.
* Additional training in behavior management is needed for regular class teachers.
The differences between high- and low-prevalence school districts that were identified in this study are differences in local practice that directly impact students and the services they receive, or don't receive. It is clear that the district in which a student lives may determine whether or not he or she is identified as eligible for special education services and, therefore, whether or not special education services will be provided.
Other Factors That Influence Prevalence
What other factors beyond local practices influence the prevalence of students with disabilities in Maine school districts? A second MEPRI study examined the relationship of special education prevalence to certain key variables. Using a Maine state policy database, the relationships among special education prevalence, poverty, geographic region, the presence of an early childhood program in a district, district size (enrollment), per-pupil expenditure, and the level of state subsidy a district receives were calculated. In data spanning the years 1996 to 2002 only poverty, as measured by the percent of students eligible for free and reduced lunch, and district size were statistically influential on districts' prevalence rates (Jain & Harris, 2001).
A third MEPRI study examined the performance of students with disabilities students on the MEA by school. The performance of a school's special education program was linked to the overall performance of the school. That is, schools that do well on the MEA have special education programs that do well. Schools that do poorly, have special education programs that do poorly. This effect was independent of both prevalence rates and exclusion rates (Jain & Harris, 2001).
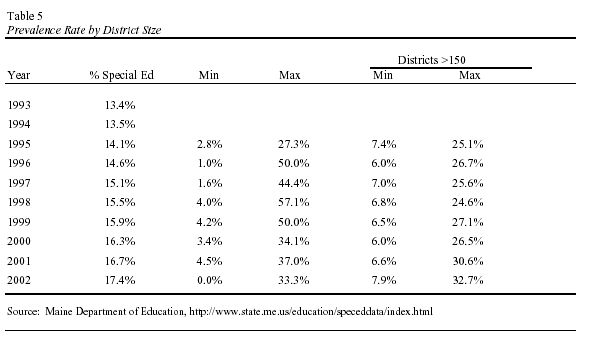
Within Maine, prevalence rates of students with disabilities vary significantly across school districts. Prevalence rates over the past 10 years have varied from 0% to 57% (Table 5) when all SAUs are considered. Very high- and very low-prevalence rates have typically been more common in small school districts (less than 150 total enrollment) in which prevalence rates are also less stable. In these districts, small changes in the number of students with disabilities result in a disproportionate change in prevalence rates. In school districts enrolling more than 150 students, the range of prevalence rates is narrower, 6% to 33% (Table 5). Thus some of the extremely high- and low-prevalence rates in Maine are an artifact of the small district sizes.
Recent data indicates that this pattern of wide variation mostly among small districts may be changing. In the last 2 years several of Maine's larger school districts have reported prevalence rates closer to the high end (greater than 30%). These findings do not affect the overall state prevalence rate but should be monitored as they may indicate new changes in the special education processes in larger districts.
In Maine, between 1996 and 2000, higher levels of poverty were also somewhat related to higher special education prevalence rates3. This finding mirrors national data (Fujiura & Yamaki, 2000). Since 2000, however, the relationship between poverty and special education prevalence in Maine is somewhat weaker. The data of the next few years will be needed to determine the direction of this trend.
Summary
The studies described above lead to the conclusion that variation in the local practices that districts use to determine eligibility for special education is the most significant factor that distinguishes between high- and low-prevalence districts. The size of a school district and its poverty rate can also partly explain the prevalence of students with disabilities within a school district although the influence of both of these factors has declined somewhat over the last 2 years.
Implications for Policymakers
Why should Maine policymakers be concerned with trends in special education enrollment and the wide variation in the prevalence of students with disabilities among school districts?
Wide variation in prevalence rates in Maine implies that special education regulations are implemented differently from district to district. Even though state law and regulations guide the delivery of special education programs and processes, their implementation is dependent on the local practices of the administrators and pupil evaluation team in each school district. Variation among districts in identification practices are compounded by the resulting inequities in the provision of special education services across districts. A student's identification as eligible for special education services, and therefore his or her access to those services, may heavily depend on the school district in which he or she resides.
The state's role in special education funding is an important consideration in finding an answer to this question. At present, Maine funds local special education programs within broad parameters, and districts have great latitude in determining how many students are enrolled in special education programs. In essence, districts that are more dependent on state funding receive a greater portion of their special education funding from the state. If the state is subsidizing local practices that result in unusually high-prevalence rates in some districts and unusually low-prevalence rates in others, a misallocation of resources could result. Scarce education resources might be misdirected because allocation is based on local practices for determining eligibility for special education services that may not reflect actual needs.
It is the role and responsibility of the state to ensure that all students with disabilities receive a "free appropriate public education in the least restrictive educational alternative." Policymakers must consider policy changes that will remove place of residence as an obstacle to special education services for students with disabilities.
Maine is moving towards high standards for all students through the Learning Results, and is in the process of reforming school funding to provide adequate resources through the Essential Programs and Services funding model. Students with disabilities, or 17% of Maine's public school enrollment, may be left behind in this effort if the delivery of the special education services largely depends on where they reside.
Part II
Special Education Funding
Introduction
Education funding in Maine is moving away from a model based on historical costs and toward an adequacy model that is based on examining the actual expenditures in typical but highly successful districts. Maine policymakers have endorsed an education funding model based on the cost of the essential programs and services that students need to achieve the Learning Results, a model derived from actual expenditures in typical, high-performing districts. However, incorporating special education funding into this model remains unaccomplished.
Part II examines special education funding in Maine, provides information about trends in special education spending and its impact on the total education budget, and summarizes different special education funding models. The paper concludes with potential strategies for state and local policymakers for achieving greater consistency in the delivery of special education programs and incorporating special education funding in essential programs and services.
The Federal Role
With the signing of the Education for All Handicapped Children Act (EHA, P.L. 94-142) in 1975, the federal government mandated free appropriate education for all children with disabilities ages 6 to 21 in the least restrictive environment. Subsequent amendments to this law extended the age range to birth to 21, added the requirement to assist secondary students with disabilities in making the transition to adulthood, added the categories of autism and traumatic brain injury, and expanded the definition of related services to include rehabilitation counseling and social work services.
EHA sought to gradually increase the federal share of special education funding to 40%, starting with 5% in FY 1978. States received federal funds based on the number of students with disabilities, as the federal government encouraged states to identify and serve all students with disabilities. The federal share of special education funding has never exceeded 14.9%.
The 1997 reauthorization of this law, renamed the Individuals with Disabilities Education Act (IDEA, P.L. 105-17), increased parental participation in decision making, required transition plans for students beginning at age 14, and that IEPs include positive behavior support plans when appropriate. This reauthorization also required that students with disabilities be included in state-wide assessment programs and placed restrictions on the discipline strategies used with students with disabilities, especially if the behavior of concern was a manifestation of the student's disability.
In addition, IDEA changed federal special education spending from a child count model to a census-based funding model. Under the census model, beginning in 2000-2001, state special education programs are funded at a flat rate based on each state's total enrollment (85%) with an adjustment for poverty (15%) once the appropriation for the prior fiscal year is exceeded. The federal government delinked special education funding from special education incidence partly because of expanding special education enrollment that remained difficult to explain. In Maine, the federal government has paid for approximately 10% of special education spending over the last 3 years. Maine districts receive federal special education funds based on their general enrollment.
The State Role
Special education programs in Maine are funded through a percentage reimbursement model. All allowable costs are eligible for state subsidy. The amounts expended on allowable costs are a local decision. The state reimburses school administrative units (SAUs) for approved special education expenditures 2 years after the costs are incurred through the state aid formula. Approved expenses include salaries and benefits for the following special education personnel: teachers, administrators, related services personnel, educational technicians, clerical staff, and contracted services. The state also reimburses districts for tuition, board, and supportive services (excluding medical costs).
In addition to students with disabilities, special education funding is provided for programs for students who are pregnant, hospitalized, confined to their homes due to illness or injury, in substance abuse programs, and those suffering from other temporary conditions. The State also pays 100% of costs for state wards, and state agency clients and subsidizes out-of-district placement costs up to the amount that exceeds three times the secondary foundation operating rate per pupil. These excess costs are subsidized in the year the expenditure occurs and are prorated when the amount of funds exceeds the amount appropriated for this purpose (Kierstead & Gray-Hanc, 1992).
Each SAU provides special education services to students and is responsible for any expenses not subsidized by the state or federal governments. All SAUs depend on local property taxes for school funding. In Maine during 1998-1999, 51% of special education funds came from the state, 41% from local taxes, and 8% from the federal government (Parish, Anthony, Merickel, & Esra, 2001).
Trends in Special Education Funding
Between 1993 and 2002 special education enrollment of students ages 3-21 years in Maine increased faster than general enrollment. The number of special education students as a proportion of the general education student population also increased from 13.4% to 17.4% (Part I, Table 3).
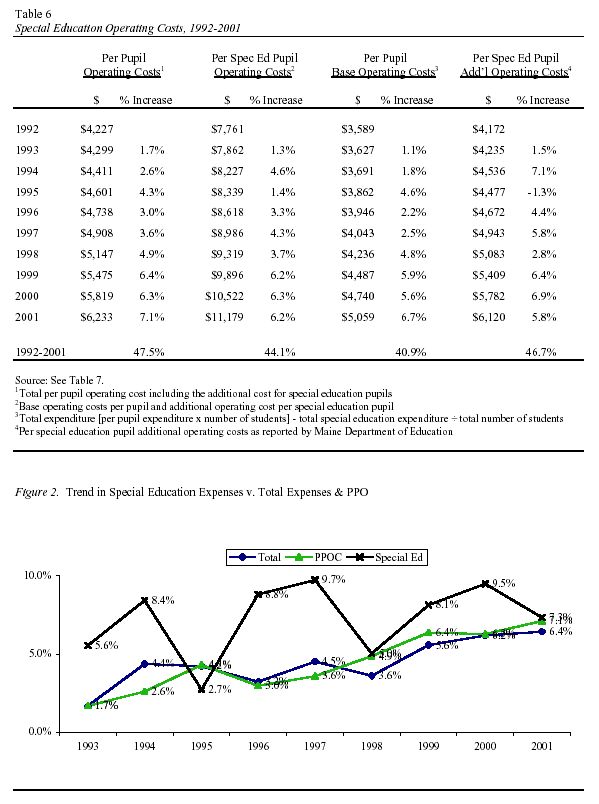
Spending for special education has also increased, driven largely by increases in the number of students with disabilities. However, over the past 10 years, changes in the per-special-education-pupil operating costs have been similar to changes in the state per-pupil operating costs (see Table 6 & Figure 2). Between 1992 and 2001, state per-pupil operating costs increased by 47.5%, and special education per-pupil operating costs increased by 44.1%. Similarly, changes in the base operating costs per pupil, and the additional operating cost per special education pupil were comparable over the last decade (see Table 6).
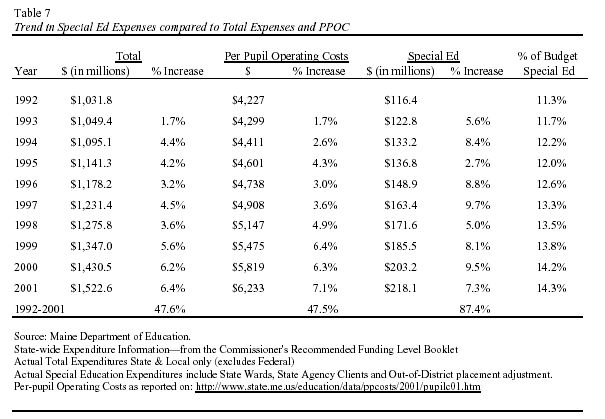
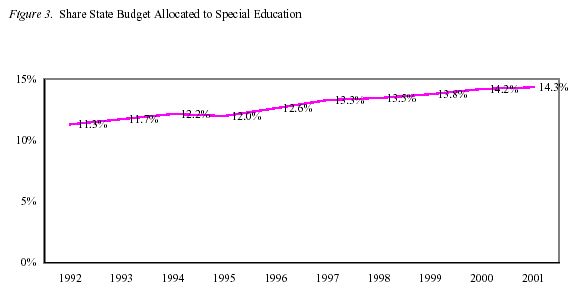
Special education spending has increased more rapidly than total education spending, 87.4% compared to 47.6% or per-pupil operating costs, 47.5% (see Table 7). This can largely be attributed to the increase in the number of students with disabilities identified as eligible for special education services compared to the general education student population. As illustrated in Figure 2, special education spending has usually increased faster than per-pupil operating costs or total education spending. As a result, the special education share of the education budget in Maine has increased from 11.3% in 1992 to 14.3% in 2001 (Table 7 and Figure 3).
Summary
During the past decade general education enrollment has decreased (-3.1%), while special education enrollment has increased (26.1%). Special education enrollment as a proportion of general education enrollment has grown from 13.4% to 17.4%.
The cost of special education has increased 87.4% since 1992 while the cost of general education has increased 47.6%. The increased cost of special education is due primarily to the increased number of students identified by local PETs as eligible for special education services. The per-pupil cost increases in general education and special education are comparable.
Special education funding increasingly consumes a greater share of the state education budget and, therefore, limits the resources available for other education programs. Under different circumstances, all programs could be funded at higher resource levels; but given budget constraints, increased funding for some programs necessarily involves funding compromises in other programs. For example, if the state special education prevalence rate had stabilized at 12.9% from 1992 on, total special education spending ($218.1 million) would have been $50 million dollars lower in 2001, even if the amount spent per special education pupil had increased by 47% during that period.
Under Maine's current special education funding formula, districts that are more dependent on state funding are subsidized for their special education expenditures at a higher rate than districts that are less dependent on state subsidies. This can result in a misallocation of resources if the state is subsidizing local practices that result in unusually high-prevalence rates in some districts and unusually low-prevalence rates in others. The unfortunate result may be that scarce special education resources are being misdirected because allocation is based more on local practices rather than actual need. Change in the current special education funding formula is needed to ensure greater equity in the distribution of state funds that support programs for students with disabilities and to maintain equity between special education and general education.
Alternative Special Education Funding Models
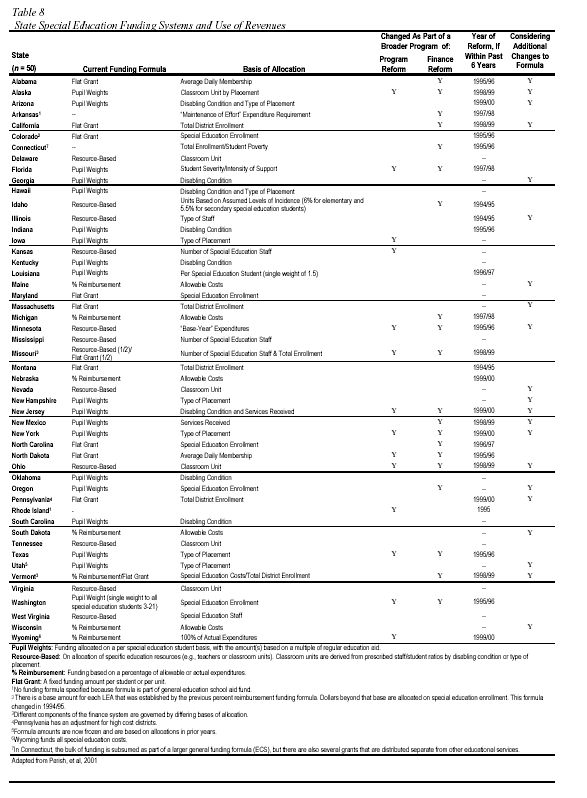
Maine is not alone in considering the possibility of changes in the way in which special education is administered and funded. More than 30 states have reformed their special education finance programs over the past 6 years. An individual state or district's approach to reform varies based on local circumstances including the goal of reform (e.g. equity, cost control) and the dominant political culture. A number of different models or formulas for funding special education have evolved and these vary considerably. Parrish (2001) and his colleagues at the Center for Special Education Finance have provided the following classification system with the caveats that there is overlap in the categories and substantial variation among states' funding formulas within the categories.
* Pupil Weights. State subsidy is allocated on a per-student basis with the amount of aid based on the relative costs of educating students with different disabilities. More severe disabilities are weighted more heavily. Approximately 40% of all states have formulas based on pupil weights (Parish et al., 2001).
* Flat Grants. State funding for special education is based on the number of students with disabilities reported by each district without regard to the severity of students' disabilities. A variation of this approach is the "census model" in which districts are funded based on an assumed percentage of students with disabilities within their total enrollment
* Resource-based. Funds are allocated based on the presumed cost of specific resources such as teachers, aides, and equipment needed to educate students with specific disabilities. Staff to student ratios and types of disabilities are included in the establishment of subsidies.
* Percentage Reimbursement. State subsidy is based on the reported costs of providing special education programs. Typically, only certain costs are allowed. In Maine, this model reimburses school districts based on their overall subsidy calculation. Most costs are reimbursed 2 years after expenditure. Some tuition and board costs are reimbursed in the same year, the rest are based on two-year-old costs.
Table 8 describes the special education funding models in all 50 states and indicates the motivation and timing of reforms. Parish et al. (2001) summarize that 40% of the states (n = 19) had formulas based primarily on pupil weights; three states used formulas that were part of their general school aid fund; and the remaining states were fairly evenly distributed across flat grants (n = 11), percentage reimbursement (n = 7) and resource based (n = 12) during the 1999-2000 school year.
Conclusions
State policymakers are striving to increase the opportunity for all Maine's students to achieve the high standards outlined in the Learning Results. However, trends in special education prevalence and in funding may compromise the state's movement toward equal educational opportunity, both for students in special education programs and those in general education.
This challenge is a complex one requiring a multifaceted solution that must include both program and finance reform. Program reform is essential to create a higher degree of uniform judgments about which students are eligible for special education and which are not. Program reform will begin the process of finance reform in that it will provide greater assurance that funds allocated for special education programs are being used for students who demonstrate actual need.
Finance reform is needed to ensure that sufficient subsidy is provided to each district so that students with disabilities have the resources necessary to achieve the Learning Results rather than providing subsidy based on what was spent in previous years. In addition, finance reform is needed to ensure equity between special education and other education programs.
The following are offered as potential strategies that might begin the process of program and finance reform.
Potential Strategies for State Leadership
* Review and refine the criteria for eligibility for special education services
* Provide professional development opportunities for directors of special education related to eligibility criteria and leadership of pupil evaluation teams
* Provide professional development opportunities for pupil evaluation teams
* Provide technical assistance to school districts in which prevalence rates differ significantly from the state average
* Encourage teacher education programs to emphasize the need for preservice teachers to gain skills in teaching students with diverse learning styles and to make appropriate referrals
* Guide school districts in creating non-special education supportive programs particularly in high-prevalence districts
* Monitor the impact of Learning Results and increased school district accountability for student achievement on special education prevalence rates
Potential Strategies for Local Leadership
* Create more non-special education alternative programs for students who are not clearly eligible for special education programs
* Provide professional development opportunities for teachers that expand their abilities to teach students with diverse learning styles and challenging behavior
* Encourage general and special educators to work collaboratively in support of all students' learning and development
* Provide professional development for pupil evaluation teams
There are two important characteristics of Maine schools that are important to consider when weighing measures that would address the wide variance in prevalence and resulting inequity in access to special education services. First, local practitioners and policymakers do not view statewide variation in prevalence as a major concern. Interviews of special education directors described earlier revealed that few were aware of the actual prevalence rate for their district and fewer still had ever examined the prevalence rates of other districts. Local practitioners and policymakers are primarily concerned with meeting students' needs and do not have a statewide perspective that allows comparison of their district to others. Second, there is a strong tradition of local control and natural resistance to changing local practices that appear to work. Without a concerted effort, led by the state and supported by the leadership of key professional organizations, there will be little impetus to make changes in local practices that could result in more equitable access to special education services for students with disabilities across Maine. The suggestions above are offered with the assumption that strong state and local leadership can provide the needed direction and incentives for program and finance reform in special education.
References
Davis, W., & Harris, W. (2000). A study of the variance in the prevalence of students with disabilities in Maine schools (Report to the Essential Programs and Services Task Force on Special Education). Orono, ME: University of Maine, Institute for the Study of Students and Risk and Maine Education Policy Research Institute.
Fujiura, G. T., & Yamaki, K. (2000). Trends in demography of childhood poverty and disability. Exceptional Children, 66, 187-199.
Jain, P., & Harris, W. J. (2001). Variation in special education prevalence and special education funding: Discussion draft (Report to the Essential Programs and Services Task Force on Special Education). Orono, ME: University of Maine, Center for Research and Evaluation, Maine Education Policy Research Institute.
Kierstead, J., & Gray-Hanc, Donna. (1992). Special education finance and forms. Augusta, ME: Maine Department of Education.
Maine special education regulations (1999). August, ME: Maine Department of Education.
Parish, T. (2000, Winter). Special education - At what cost to general education? The CSEF Resource. Palo Alto, CA: Center for Special Education Finance. Retrieved August 6, 2002 from http://csef.air.org/win2kspd.htm
Parish, T., Anthony, J., Merickel, A., & Esra, P., (2001). State special education finance systems and expenditures, 1999-00 DRAFT . Palo Alto, CA: Center for Special Education Finance.
U.S. Department of Education. (2001). Twenty-third annual report to Congress on the implementation of the Individuals with Disabilities Education Act. Washington, DC: Author.
1 The identification rate as reported by the Maine Department of Education (16.7% in 2001) is higher than the identification rate reported by the U.S. Department of Education (11.3% in 2001). This is because Maine includes all 3 to 21 year olds receiving special education services, whereas the federal government only includes 6 to 21 year olds. In addition, the federal government estimates Maine's general education enrollment; whereas, the Maine Department of Education uses actual enrollment figures. The federal estimates of Maine's general education population over the last few years have typically been higher than the actual general enrollment-the federal government has underestimated Maine's identification rate.
2 Directors of Special Education were interviewed in 15 pairs of school districts that were matched by size and median household income and represented urban and rural districts throughout 12 of Maine's 16 counties. One district in each pair was a "high identifier" and the other a "low identifier."
3 Pearson's correlation coefficients between percent of students eligible for free and reduced lunch and a district's prevalence rate ranged from 0.33 to 0.40 from 1996 to 2000 (p < 0.00). The magnitude of these correlations declined to 0.18 (p < 0.01) in 2001 and to 0.27 (p < 0.01) in 2002